第11章 データの処理
地理的条件による点データの抽出
内陸,海域,湖など,地理的条件によって点データを抽出するselect関数が存在する.
参照: GMTの例,PyGMT公式マニュアル
https://docs.generic-mapping-tools.org/latest/gallery/ex24.html https://www.pygmt.org/latest/api/generated/pygmt.select.html
<out> = pygmt.select(
    <オプション>
    )
条件により与えたデータから地理的条件によってデータを抽出できる. 海岸線基準,点または線からの距離基準,多角形・緯度経度範基準など. 詳しくは公式マニュアルを参照.基準は次の6つ:
- inside a rectangular region (region [and projection])
- within dist km of any point in pointfile
- within dist km of any line in linefile
- inside one of the polygons in the polygonfile
- inside geographical features (based on coastlines)
- has z-values within a given range, or
- inside bins of a grid mask whose nodes are non-zero
点からの距離によるデータ分類
ある点からの一定距離(degree)内にある点を抽出する.
pygmt.select(
    data = <data>,
    dist2pt = '<lon>/<lat>+d<distance><unit>',
    coltypes = 'g',
    [reverse = 'c'] # 円の外側の点を抽出する場合.
)
dist2ptに基準点の座標と距離を与える.
coltypes = ‘g’としないと地理的距離を使用できず, 距離の単位も指定できない(指定しても無視される)ので注意.
以下の例ではcoltypes=‘g’を使用していないため, 地理的距離が適用されていない. 例)
import numpy as np
dat = np.random.rand(5000,2)*5+40

dat2 = pygmt.select(
    data = dat,
    dist2pt = "40/40+d2",
    # reverse='c',
).values

fig = pygmt.Figure()
fig.coast(
    land = 'grey80',
    region = [40,45,40,45],
    projection = 'M4c',
    frame = 'agf',
)
fig.plot(
    x = dat[:,0],
    y = dat[:,1],
    style = 'c2p',
)
fig.plot(
    x = dat2[:,0],
    y = dat2[:,1],
    style = 'c1p',
    # pen = 'red',
    fill = 'red',
)
fig.show()
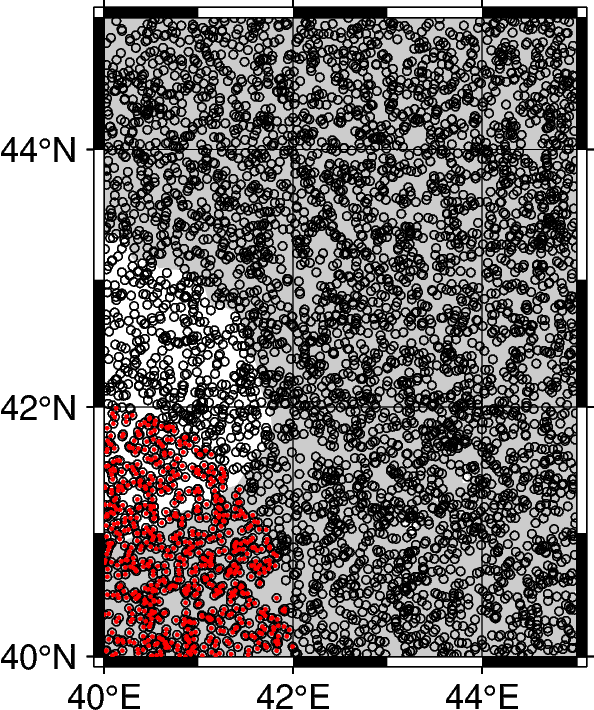
南西端の点から距離「2」以内の点に色を付けた図.coltype=‘g’を与えていないため地理的距離で処理されていない.
水・陸でのデータ分類
海と陸でデータを分別する場合:
mask = 'wet/dry'
または
mask = 'ocean/land/lake/island/pond'
それぞれを含むなら「k」(kept), 除外するなら「s」(skipped)を指定する. 文字列またはリストで指定.
例)ランダムな点のうち,内陸を青,海域を赤でプロットする:
import pygmt
import numpy as np

"""描画範囲,図法"""
rgn = [134,138,33,36]
prj = 'M6c'

"""random data作成"""
xlen = rgn[1]-rgn[0]
ylen = rgn[3]-rgn[2]

dat = np.random.rand(5000,2)
dat[:,0] = dat[:,0]* xlen + rgn[0]
dat[:,1] = dat[:,1]* ylen + rgn[2]

"""陸海でデータ分離"""
land = pygmt.select(
    data = dat,
    mask = 's/k/k/k/k',
    )
ocean = pygmt.select(
    data = dat,
    mask = 'k/s/s/s/s',
    )

"""プロット"""
fig =pygmt.Figure()
# 海岸線
fig.coast(
    shorelines = '0.5p,black',
    water = 'blue@90',
    land = 'green@90',
    projection = prj,
    region = rgn,
    )

# 内陸
fig.plot(
    data = land,
    style = 'c2p',
    color = '#33CCFF@50',
    )
# 海域
fig.plot(
    data = ocean,
    style = 'c2p',
    color = 'red@50',
    )

#枠
fig.basemap(
    frame = 'agf',
    )
fig.show()
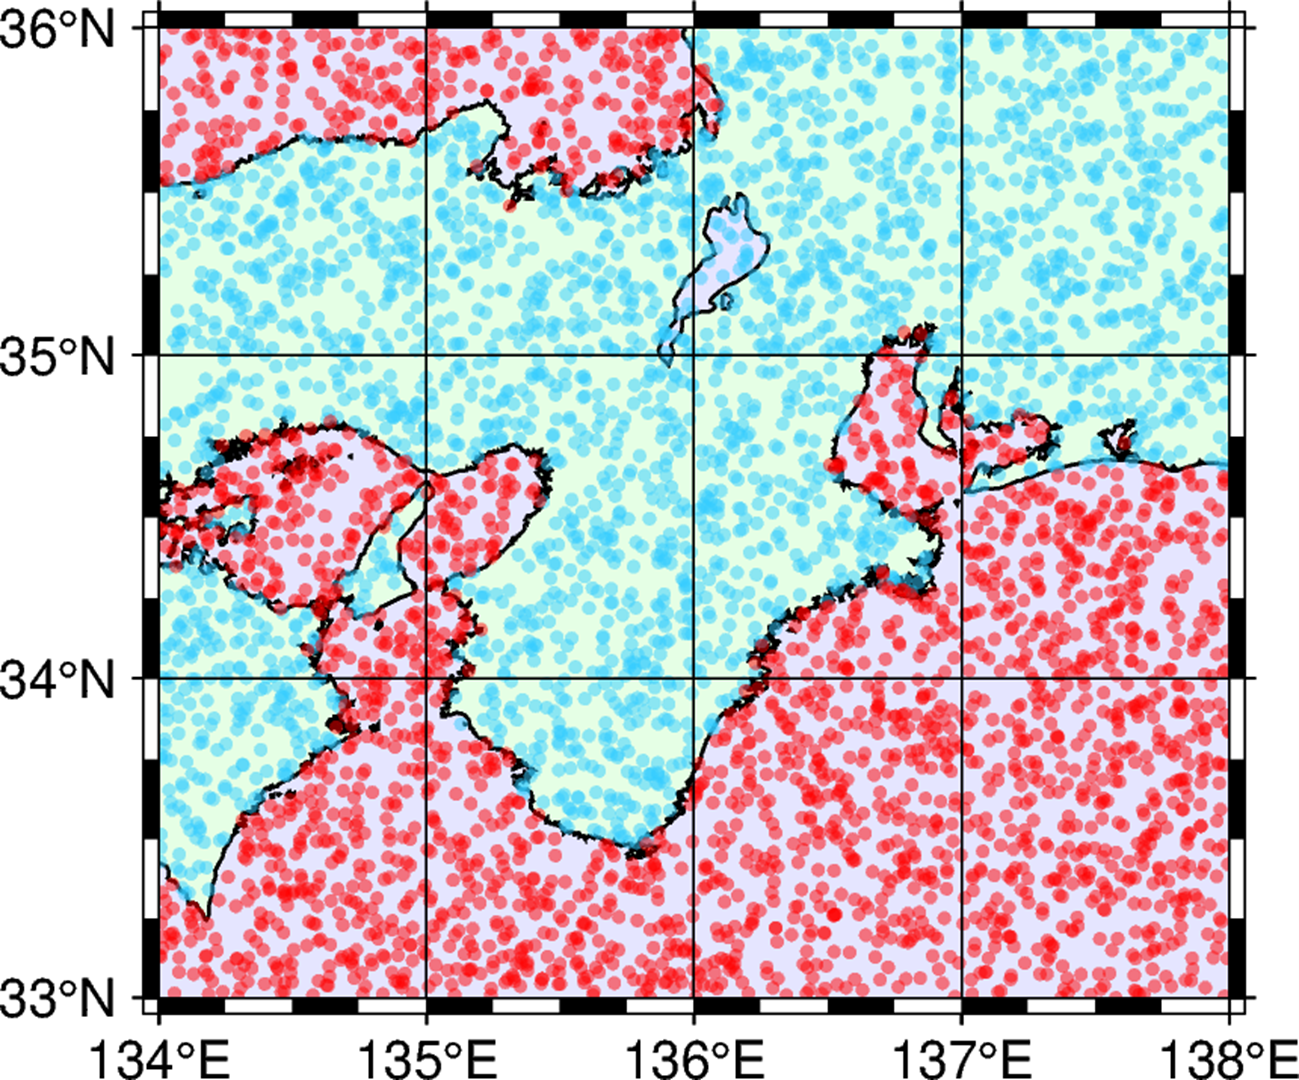
select関数による海陸での点の分別結果.