第4章 点・図形のプロット
シンボル(スタイル)の指定
style = <symbol><size>
plotメソッドのシンボルの種類とサイズを指定する.
シンボルの種類はc(:circle)のように対応する文字(参考: 図*※相互参照無効* https://www.pygmt.org/latest/gallery/symbols/basic_symbols.html#sphx-glr-gallery-symbols-basic-symbols-py)で指定する.
ただし,このときのシンボルの記号は,同じ図形であっても前線(第*※相互参照無効*節)の場合とは異なることに注意.
シンボルとその指定記号.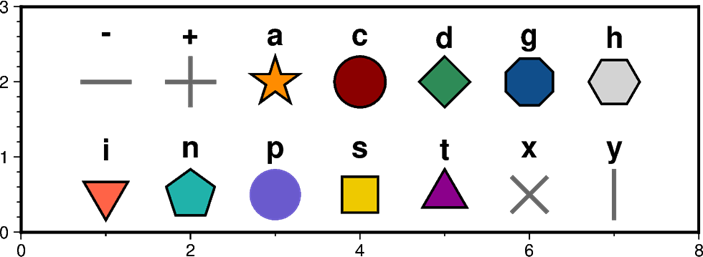
例)
fig.plot(
    ...,
    style = 'r2p',
    ...
    )
沈み込み帯など図形付きの曲線を描くときとは,同じ図形でも文字が違うことに注意.
カラーマップの適用
例えば震源の深さを点の色で示したいときなど.
# cmapを指定
pygmt.makecpt(
    cmap = '<cmap>',
    series = [<min>, <max>]
    ...,
    )
# 指定したcmapに従い着色してプロット
fig.plot(
        x = <x>,
        y = <y>,
        cmap = True,
        color = <値: 各点の値が入った配列>,
        ...,
)
cmap=Trueとした上でcolorに値を与える. するとmakecptのseries引数で指定した値域に従って,plotのcolorに与えた値に相当する色が点に着色される.
通常plotメソッドではデータをdata引数でx, yを分けずにまとめて与えられるが, cmapを使用する際はx,yの値を別にして与えなければならないことに注意(バグ? 仕様?).
値に基づくサイズ変更
マグニチュードによって震源の大きさを変えてプロットしたいときなど.
fig.plot(
        x = <x>,
        y = <y>,
        size = <値: 各点の値が入った配列>,
        ...,
)
plotメソッドのsize引数に各点の値が入った配列を与えることで,値に従って点のサイズを指定できる. ただしcolor(\rightarrow 第*※相互参照無効*節)のときと同様,データはdata引数でなくx,y引数に分けて与えなければならない.
地図投影上での楕円のプロット
地図上に震源などの誤差楕円を示すとき, 楕円を地図上に正しく投影したい.
PyGMT(GMT)では楕円を地図上にプロットする機能が存在する. styleにE(必ず大文字)を指定し,その後に長軸の方位角,長軸半径(km),短軸半径(km)を記すことで, 投影図法に基づいてゆがめた楕円をプロットできる. 小文字のeにすると,地理的な投影や距離に関係なく,他のcなどのシンボルと同様に楕円が処理されてプロットされるので注意.
fig.plot(
    x = ...,
    y = ...,
    style = 'E<azimuth_deg>/<major_km>/<minor_km>',
    ...
)
例)
import pygmt
rgn = [-40,40,-30,70]
prj = 'M6c'

fig = pygmt.Figure()
fig.coast(
    region = rgn,
    projection = prj,
    frame = 'ag10f',
    shorelines = '0.1p',
    land = 'grey',
)

# E: The shape of the ellipse will be affected by the properties of the map projection.
fig.plot(
    x = [20,20,20],
    y = [0,30,60],
    style = 'E0/1110/2220',
    pen = '1p,red',
)

# e: This yields a Cartesian ellipse whose shape is unaffected by the map projection.
fig.plot(
    x = [-20,-20,-20],
    y = [0,30,60],
    style = 'e90/1/2',
    pen = '1p,navy',
)

fig.show()
fig.savefig(
    "/mnt/c/Users/ERI/Aki/MyNotes/PyGMT/fig/elliplse.pdf"
)
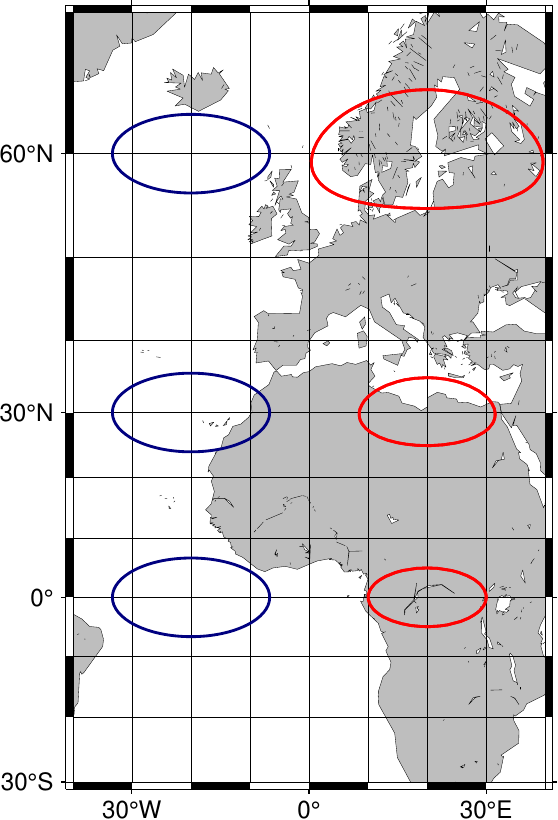
地図投影によらない楕円(左,青, style e)と地図投影に従った楕円(右,赤, style E).右側の楕円は球面に従ってプロットされているため,長軸半径が緯度0°に比べて60°では地図上では倍に伸びて見える.styleをEにして描かれる楕円を用いれば,誤差楕円を描画できる.
参照: https://docs.generic-mapping-tools.org/6.1/psxy.html
-Se
ellipse. Direction (in degrees counter-clockwise from horizontal), major\_axis, and minor\_axis must be found in columns 3, 4, and 5. This yields a Cartesian ellipse whose shape is unaffected by the map projection.
\\
-SE
Same as -Se, except azimuth (in degrees east of north) should be given instead of direction. The azimuth will be mapped into an angle based on the chosen map projection (-Se leaves the directions unchanged.) Furthermore, the axes lengths must be given in geographical instead of plot-distance units. An exception occurs for a linear projection in which we assume the ellipse axes are given in the same units as -R. For degenerate ellipses (circles) with just the diameter given, use -SE-. The diameter is excepted to be given in column 3. Alternatively, append the desired diameter to -SE- and this fixed diameter is used instead. For allowable geographical units, see Units [Default is k for km]. The shape of the ellipse will be affected by the properties of the map projection.