第6章 作品例
数学風グラフ
import numpy as np
import matplotlib.pyplot as plt

fig, ax = plt.subplots(figsize=(4,4))

# frame
ax.spines[:].set_position('zero')
ax.set_aspect('equal','box')
ax.tick_params(direction = 'inout')
ax.set_ylim(-1.5,1.5)
ax.set_xlim(-1.5,1.5)
# ax.grid()

# data
ax.scatter(
    x=0,
    y=0,
    marker = 'o',
    c = 'r',
    s = 50,
    label = 'zero',
)
ax.scatter(
    x=2/np.sqrt(3),
    y=0,
    marker = 'o',
    c = 'b',
    s = 50,
    label = 'pole',
)

# label
ax.text(
    x = ax.get_xlim()[-1]*1.05,
    y = 0,
    s = 'Re'
)
ax.text(
    x = 0,
    y = ax.get_ylim()[-1]*1.05,
    s = 'Im'
)

# unit circle
theta = np.linspace(0,2,100) * np.pi
x = np.cos(theta)
y = np.sin(theta)
ax.plot(
    x,y,
    lw = 0.8,
    ls = '--',
    c = 'k'
)
ax.arrow(0,0,
        ax.get_xlim()[-1],
        0,
        width=0,
        head_width = 0.1,
        head_length=0.15,
        overhang=0.3,
        length_includes_head=True,
        fc = 'k',
        lw=0,
        )
ax.arrow(0,0,
        0,
        ax.get_ylim()[-1],
        width=0,
        head_width = 0.1,
        head_length=0.15,
        overhang=0.3,
        length_includes_head=True,
        fc = 'k',
        lw=0,
        )

ax.legend(
    # frameon=False,
    fancybox = False,
    edgecolor = 'k',
    ).get_frame().set_linewidth(0.8)

fig.tight_layout()
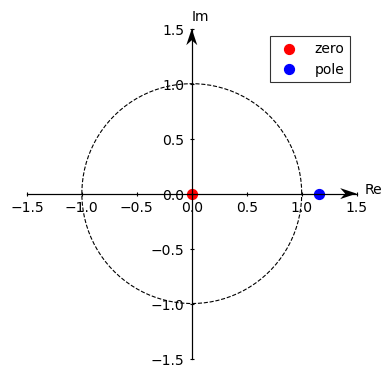
数学風グラフ.