第5章 軸・ラベル・枠
本章では断りのない限り,以下のようなグラフを作った場合を前提とする.
fig, ax = plt.subplots(
    figsize = (4,4),
    ncols = 1,
    nrows = 1,
    )
軸・目盛り
軸の縦横比
グラフの両軸のサイズ比を同じにできる.
ax.set_aspect('equal')
さらに以下のようにすると同一縦横比かつ正方形のグラフになる. ただしxlim, ylimは設定しないこと.
ax.set_aspect('equal', 'box')
import matplotlib.pyplot as plt

fig, ax = plt.subplots(figsize=(4,4))
ax.set_aspect('equal')

ax.set_xlim(-2,2)
ax.set_ylim(-1,1)

ax.grid()
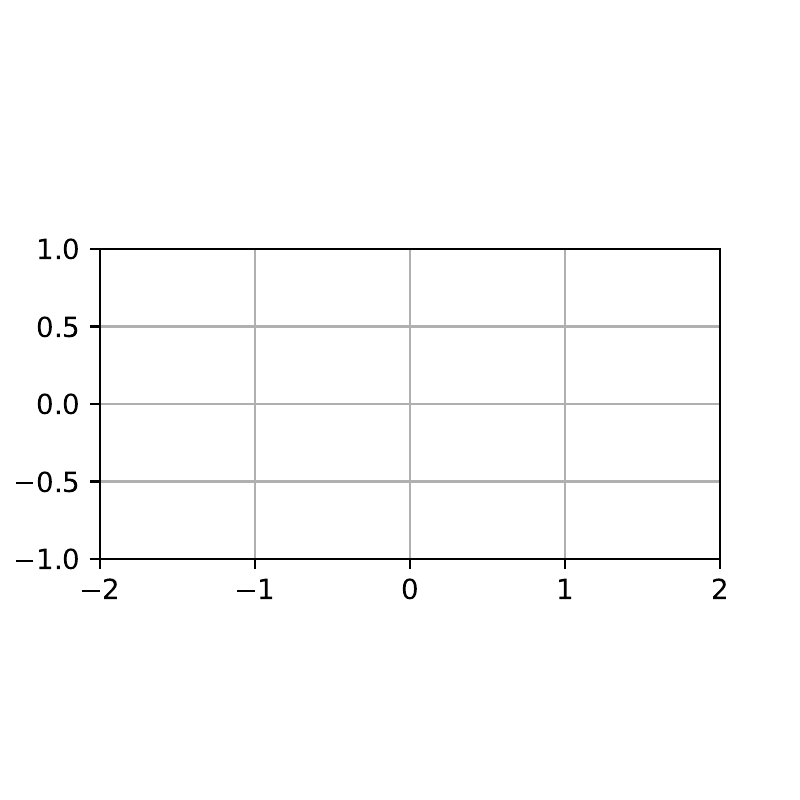
軸の縦横比をそろえた例.
軸の位置
デフォルトでは軸はグラフの端にあるが,これをグラフの中心や0の位置に変更できる.
軸を図の中心に置く.
ax.spines[:].set_position('center')
軸を0の位置に置く.
ax.spines[:].set_position('zero')
import matplotlib.pyplot as plt
import matplotlib.ticker as ticker

fig, ax = plt.subplots(figsize=(4,4))

ax.set_aspect('equal')
ax.spines[:].set_position('zero')
ax.tick_params(direction='inout')

ax.set_xlim(-1,1)
ax.set_ylim(-1,1)

locator =  ticker.IndexLocator(base=0.5,offset=-0)
locator =  ticker.MultipleLocator(0.5)

ax.xaxis.set_major_locator(locator)
ax.yaxis.set_major_locator(locator)

yticks = ax.get_yticks()
yticks = yticks[yticks!=0]

ax.set_yticks(yticks)
ax.grid()

ax.set_xlim(-1,1)
ax.set_ylim(-1,1)

fig.savefig('zeroaxis.pdf')
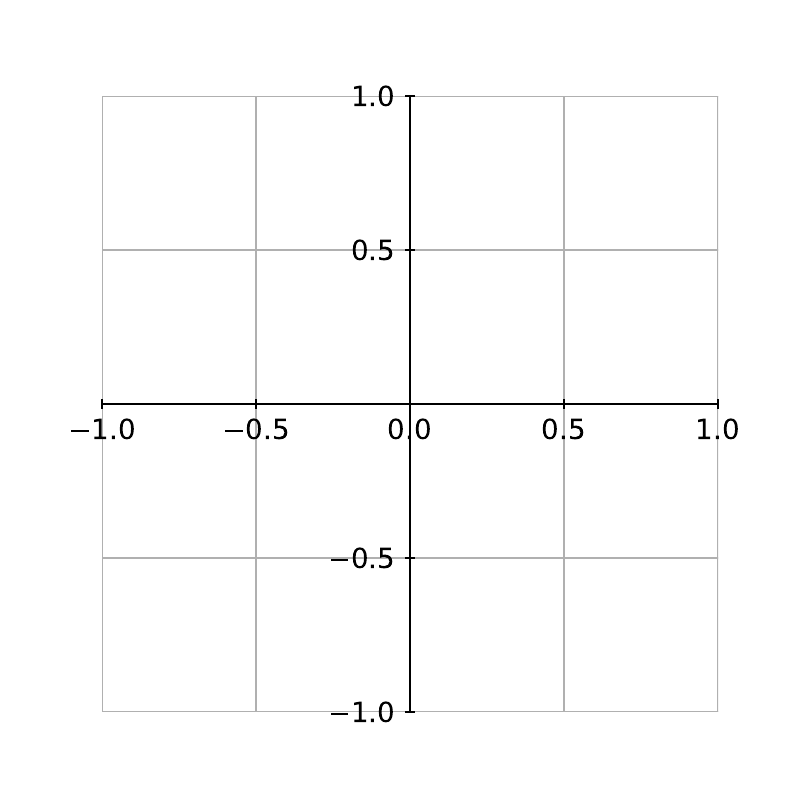
軸を0の位置に置いた例.
軸の反転
次のようにして任意の軸の向きを反転できる.
ax.invert_xaxis()
ax.invert_yaxis()
目盛り間隔
補助目盛
次のように主目盛りを等分する数を指定することで 補助目盛を追加できる.
from matplotlib.ticker import AutoMinorLocator
...
ax.xaxis.set_minor_locator(AutoMinorLocator(<分割数>))
ax.yaxis.set_minor_locator(AutoMinorLocator(<分割数>))
主目盛りを5等分する補助目盛りを追加.
目盛り線のスタイル
長さと太さ
目盛り線の長さや太さは次のように変更する.
ax.tick_params(width=<width>, length=<length>) # 主目盛
ax.tick_params(width=<width>, length=<length>, which = 'minor') # 補助目盛
なお,長さは負にしても内側に目盛り線を描けるわけではない.
四方の目盛りとアノテーションの有無
ax.tick_params(top = <True/False>, labeltop = <True/False>, which='both')
ax.tick_params(bottom = <True/False>, labelbottom = <True/False>, which='both')
ax.tick_params(left = <True/False>, labelleft = <True/False>, which='both')
ax.tick_params(right = <True/False>, labelright = <True/False>, which='both')
上記のように上下左右の縁ごとに,目盛り・アノテーションの有無を指定できる. ややこしいが,ここでのlabelはax.set_xlabelなどで付与するラベル(軸の名前)とは異なる.
あるいは次のように上下・左右で指定することもできる:
ax.xaxis.set_ticks_position('both')
ax.yaxis.set_ticks_position('both')
なお,デフォルトの目盛りとアノテーションは左と下.
内向き目盛り
ax.tick_params(which ="both",direction = 'in')
軸ラベルの位置
ax.xaxis.set_label_position('<top/bottom>')
ax.yaxis.set_label_position('<left/right>')
これを用いることで軸ラベルをグラフの上や右に付加できる.
枠線・グリッド
枠線の太さ
ax.spines[:].set_linewidth(<width>)
グリッドとそのスタイル
ax.grid(
    which = 'major',
    color = '<color>',
    linestyle = '<style>',
    linewidth = <width>,
    )
以上を活用して,次の例のようなプロットエリアを作成できる:
import matplotlib.pyplot as plt
from matplotlib.ticker import AutoMinorLocator

fig, ax = plt.subplots(1,1,figsize=(4,3))

# 補助目盛
ax.xaxis.set_minor_locator(AutoMinorLocator(5))
ax.yaxis.set_minor_locator(AutoMinorLocator(5))
# 上下左右の目盛り
ax.tick_params(top = True, labeltop = True, which='both')
ax.tick_params(bottom = True, labelbottom = False, which='both')
ax.tick_params(left = True, labelleft = True, which='both')
ax.tick_params(right = True, labelright = False, which='both')
# 目盛り線のスタイル
ax.tick_params(width=0.5, length=5)
ax.tick_params(width=0.5, length=3, which = 'minor')
# 内向き目盛り線
plt.tick_params(which ="both",direction = 'in')

# 軸の向きを反転
ax.invert_yaxis()

# 軸ラベル追加
ax.set_xlabel('xlabel')
ax.set_ylabel('ylabel')
# 軸ラベルの位置
ax.xaxis.set_label_position('top')

# 枠線
ax.spines[:].set_linewidth(1)
# グリッド
ax.grid(
    which = 'major',
    color = 'k',
    linestyle = '--',
    linewidth = 0.8,
    )

fig.show()
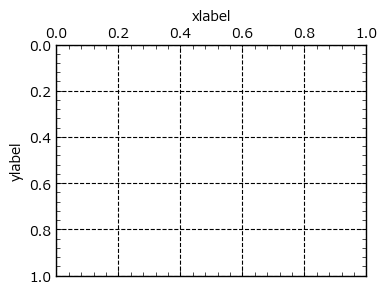
軸・目盛り・グリッドなどの調整例.